
Home / Strategies
Automated models · $120 / monthThree ICT models,
running on their own.
Each strategy combines the indicators in a flexible sequence — the raid, the divergence, the higher-timeframe zone, the entry gap — then manages the position from fill to flat. Run them unattended, or arm each setup yourself from the panel. Every report below is published in full.
Venom Model
The session takes out a low. ES refuses to follow, printing SMT. Price closes back through the gap that caused the move — and that failed gap becomes the entry. Venom is the highest-frequency model in the pack, built entirely around the inversion.
How the algorithm sequences it
- Raid — a qualified swing point is swept, with displacement back through the level
- Divergence — SMT against the correlated instrument on the timeframes you enable
- Context — the higher-timeframe zone the move is happening inside
- Entry — the inversion of the fair value gap, with a tick margin on the confirming close
- Management — stop below the inversion, target by ratio or fixed ticks, optional runner on the trailing engine
Every filter is optional. Require the sweep or ignore it, demand SMT or trade without it — the same strategy can run tight or loose depending on how much confluence you want.
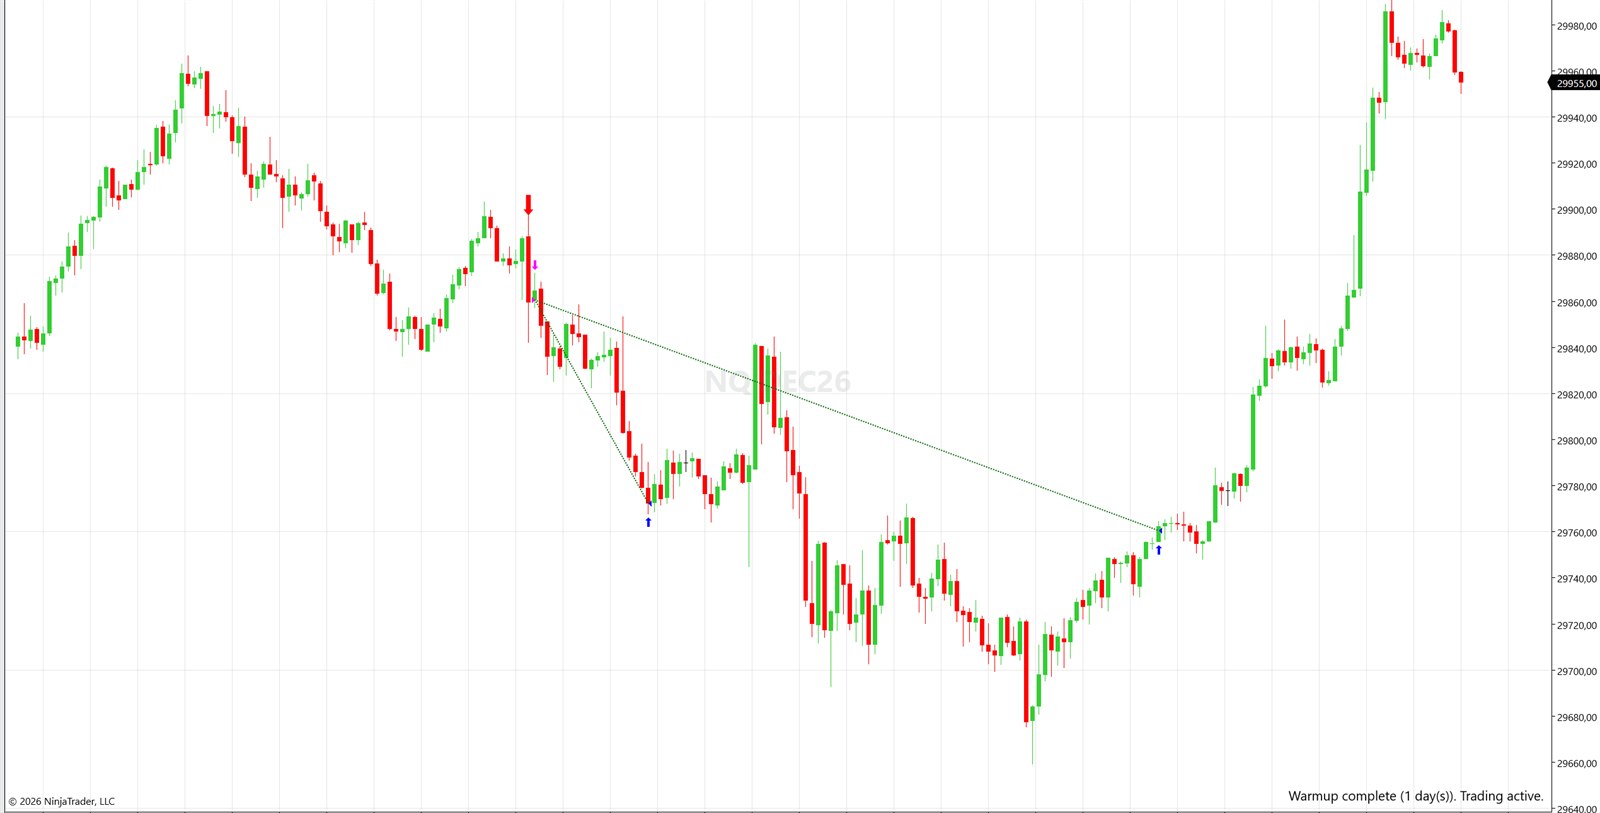
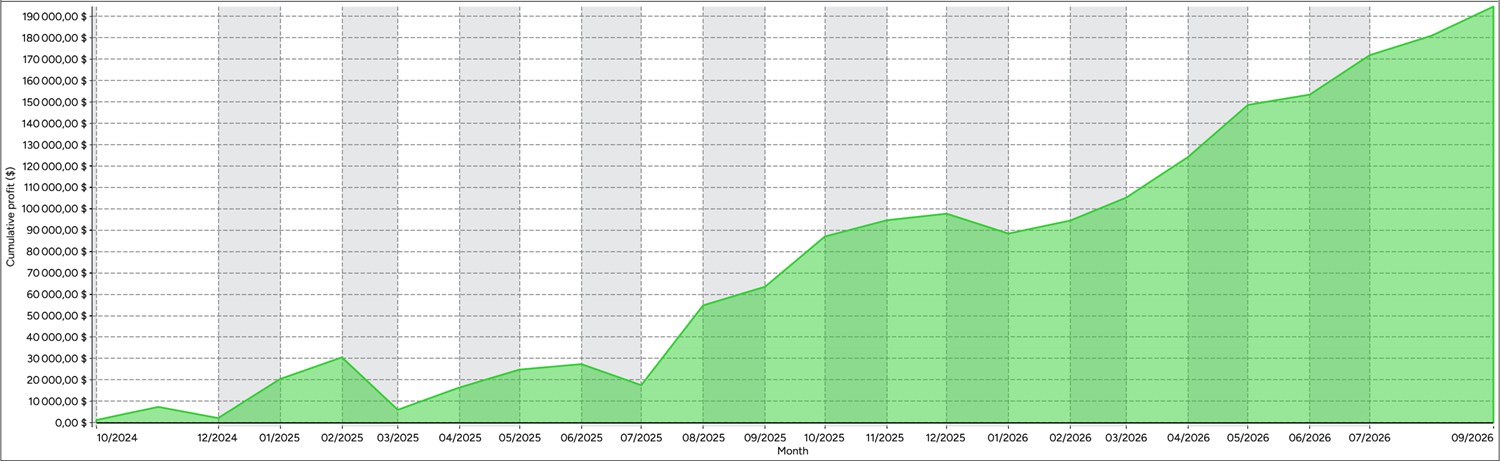
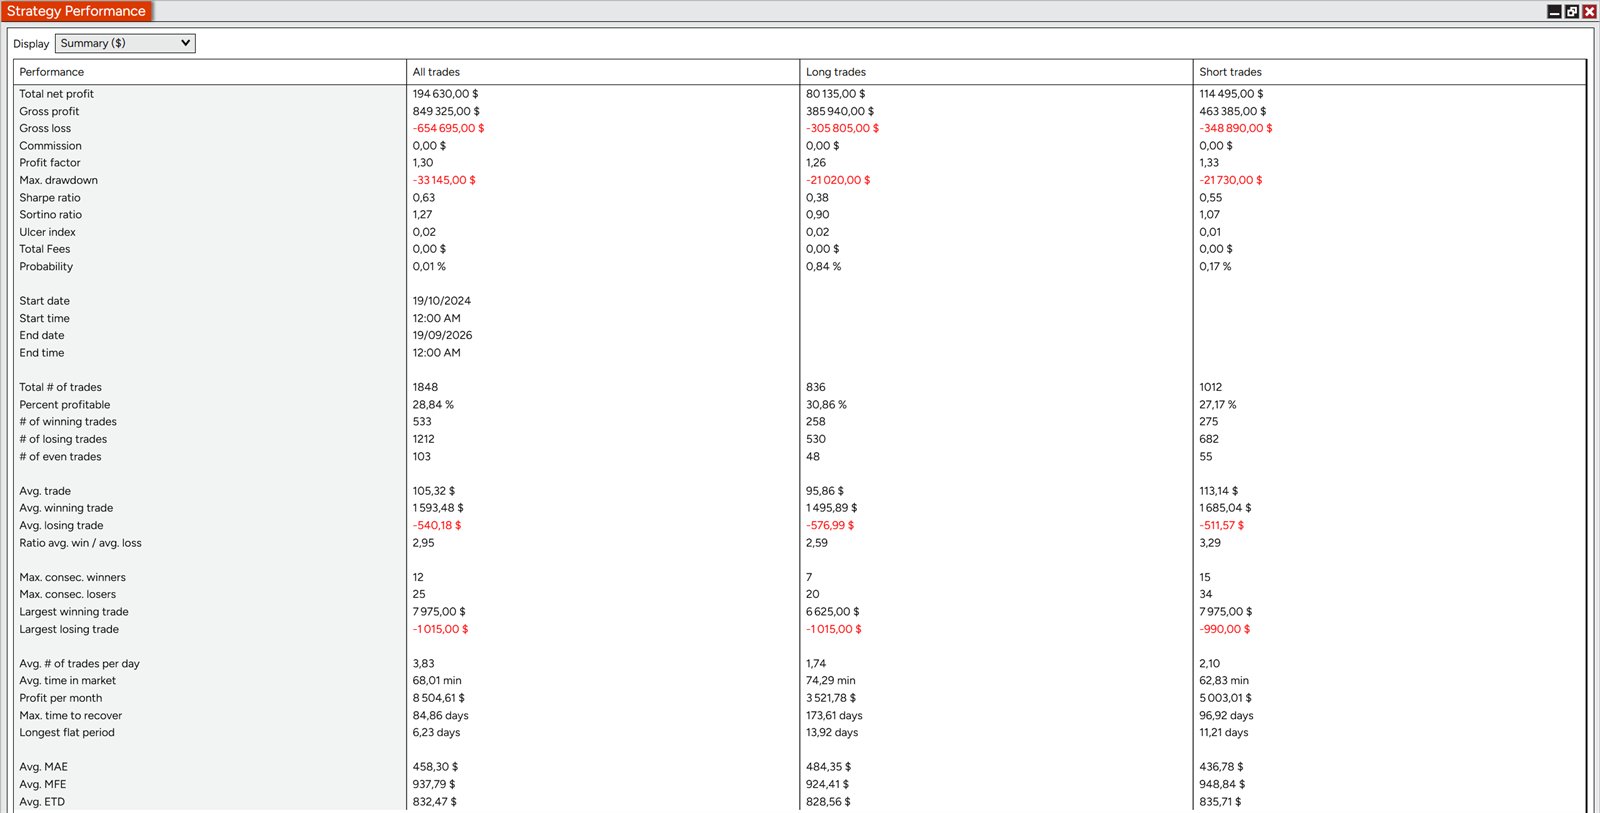
Test conditions: NQ DEC26, 1 contract, 19 Oct 2024 → 19 Sep 2026, commissions excluded. Sharpe 0.63 · Sortino 1.27 · longest flat period 6.2 days · max consecutive losers 25.
ICT 2022 Model
The model that made the framework famous: take the liquidity, displace away from it with intent, then enter on the retracement into the fair value gap that displacement created. Target the opposing pool. Tested here across nearly four years of NQ data.
How the algorithm sequences it
- Liquidity taken — a qualified high or low is swept within the allowed distance and bar count
- Displacement — the move away must clear a minimum size in ticks, not just drift
- The gap — the fair value gap left by that displacement becomes the entry zone
- Retracement entry — a limit into the gap, with stop placement offset in ticks
- Exit — ratio-based target, fixed ticks, or trailed once the runner is in profit
Its win rate sits near 32% — the model is built on a 2.26 average win-to-loss ratio. Small losses, patiently repeated, are the point.
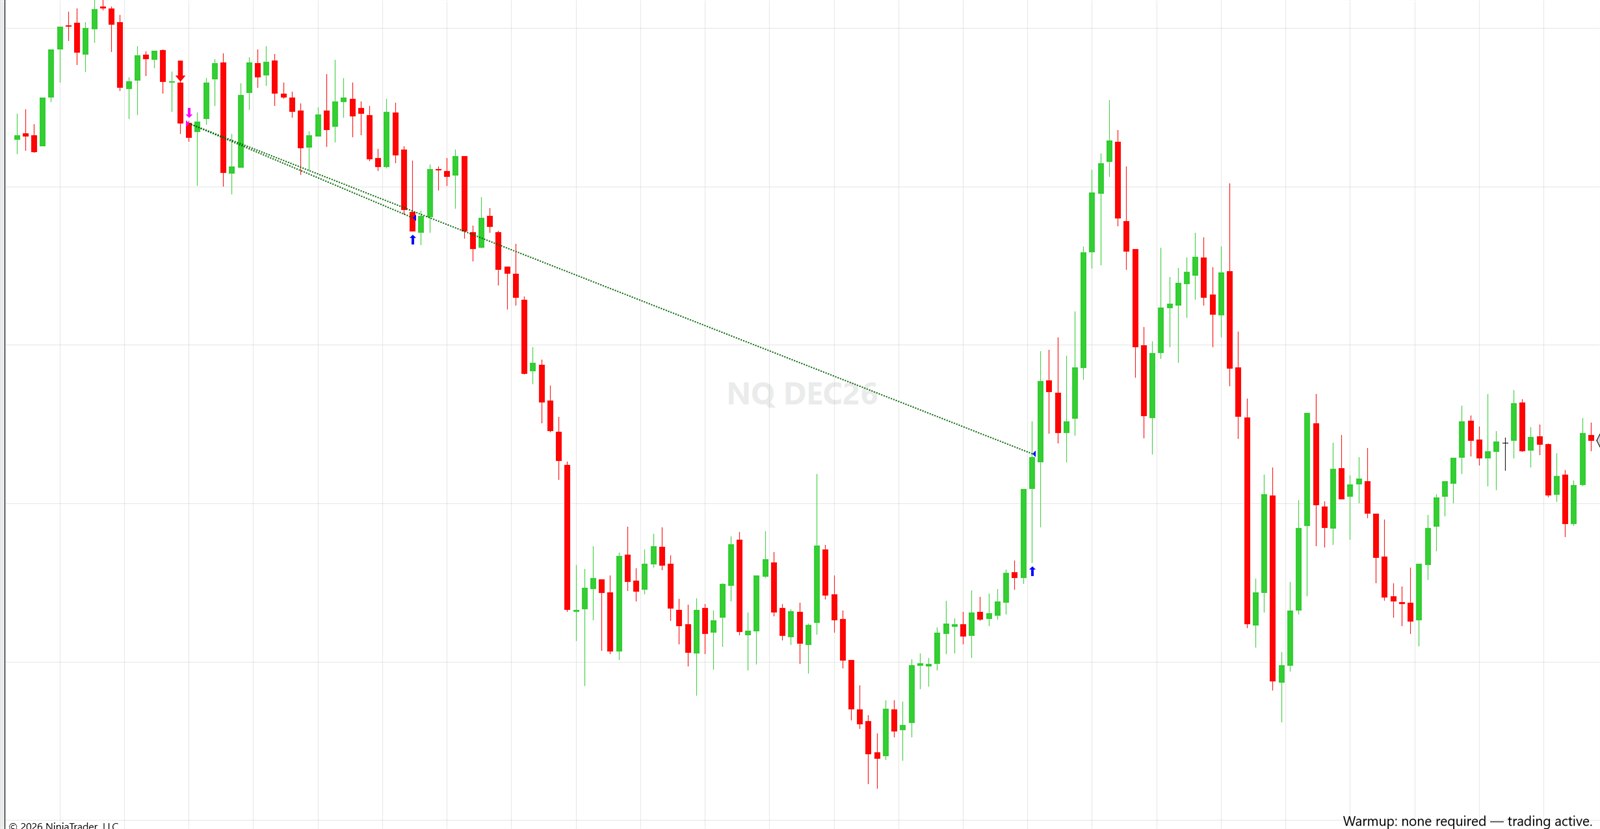
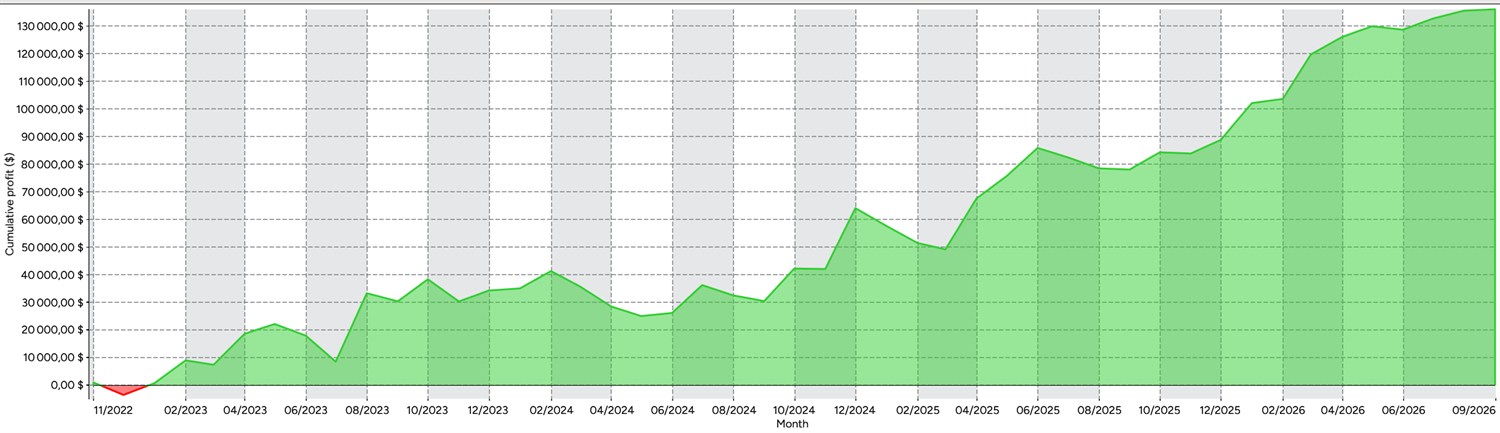
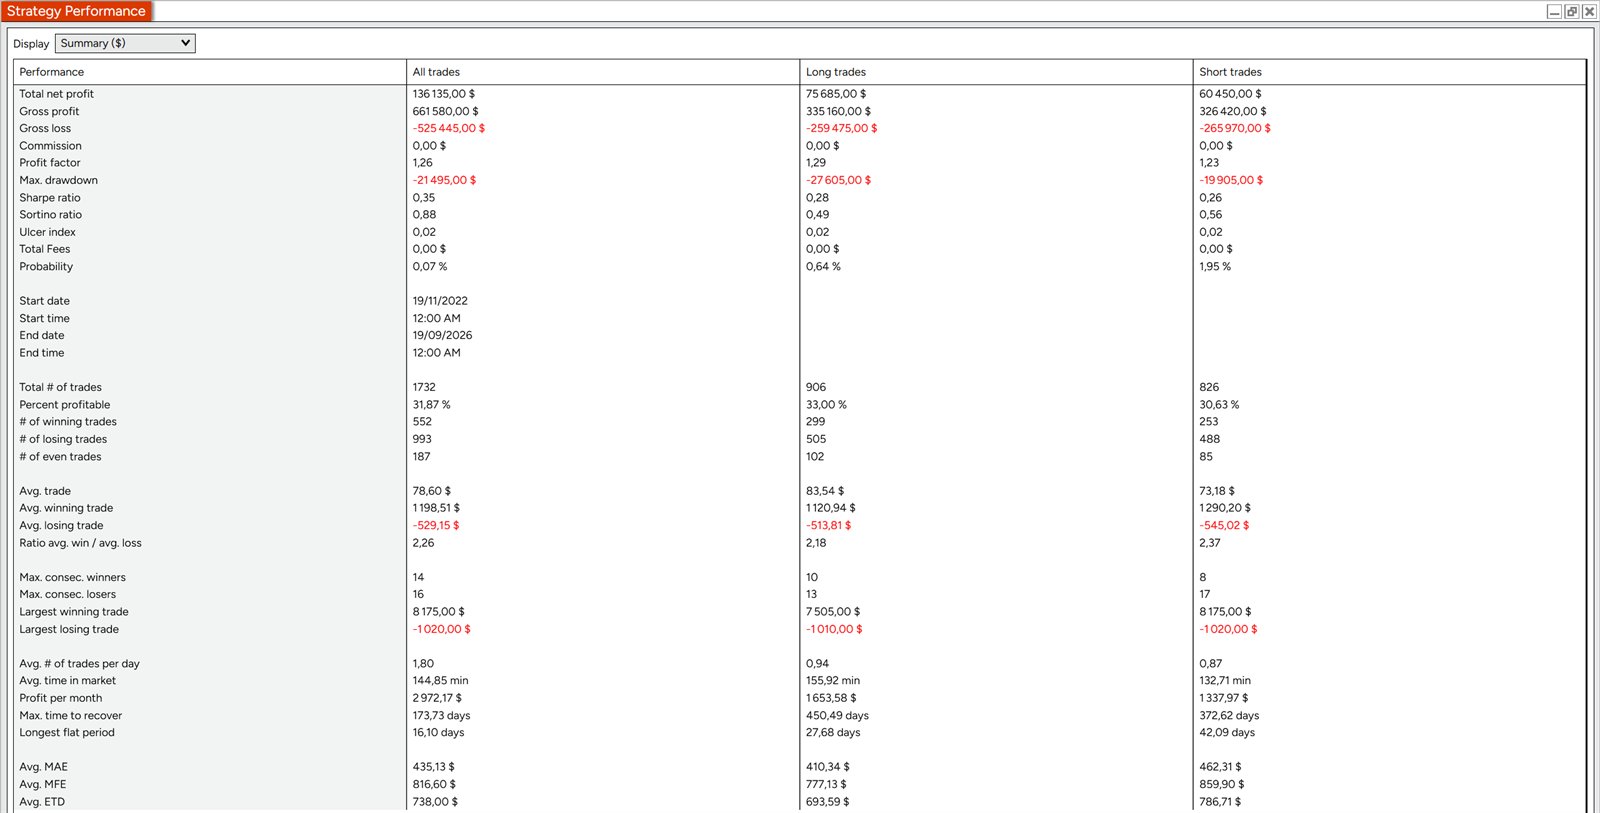
Test conditions: NQ DEC26, 1 contract, 19 Nov 2022 → 19 Sep 2026, commissions excluded. Max consecutive losers 16 · average time in market 145 minutes · 1.8 trades per day.
Unicorn Model
A breaker block and a fair value gap occupying the same price — the overlap ICT calls the unicorn. It does not appear often, which is exactly why it is worth waiting for: the highest profit factor and the smallest drawdown of the three, from a fraction of the trades.
How the algorithm sequences it
- Breaker formed — the 1-2-3-4 sequence completes and the block is registered
- Overlap check — a fair value gap must sit inside that block for the setup to qualify
- Confluence — optional SMT and sweep confirmation before the order is allowed
- Entry — on the retest of the overlapping zone, stop beyond the breaker
- Runner — a second position can be split off and trailed for the extended move
143 trades in eleven months — roughly one every other day. This is the model you run alongside the others, not instead of them.
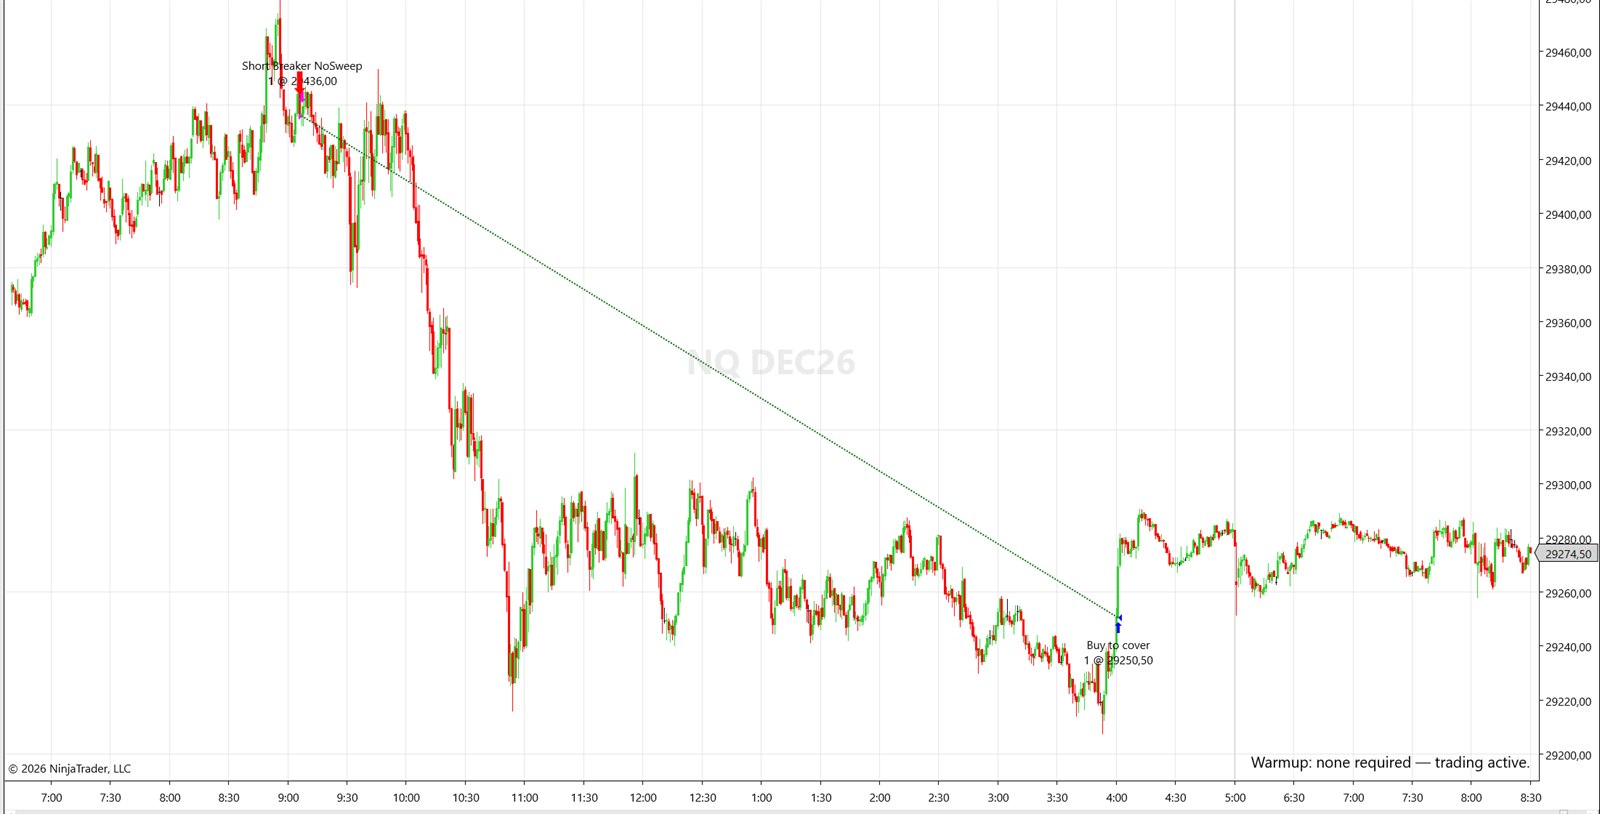
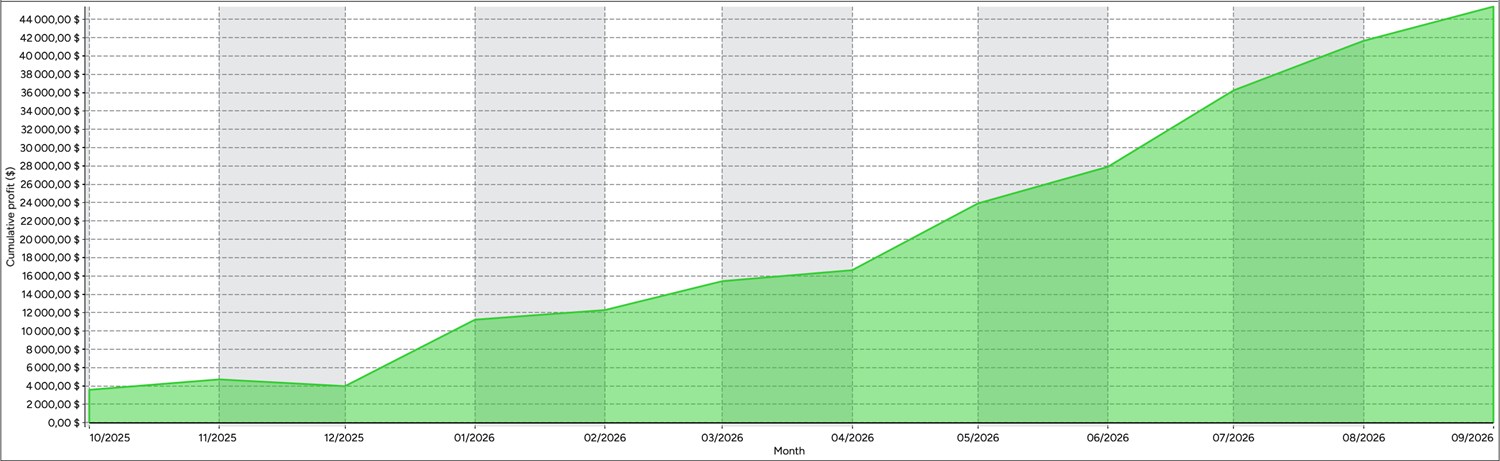
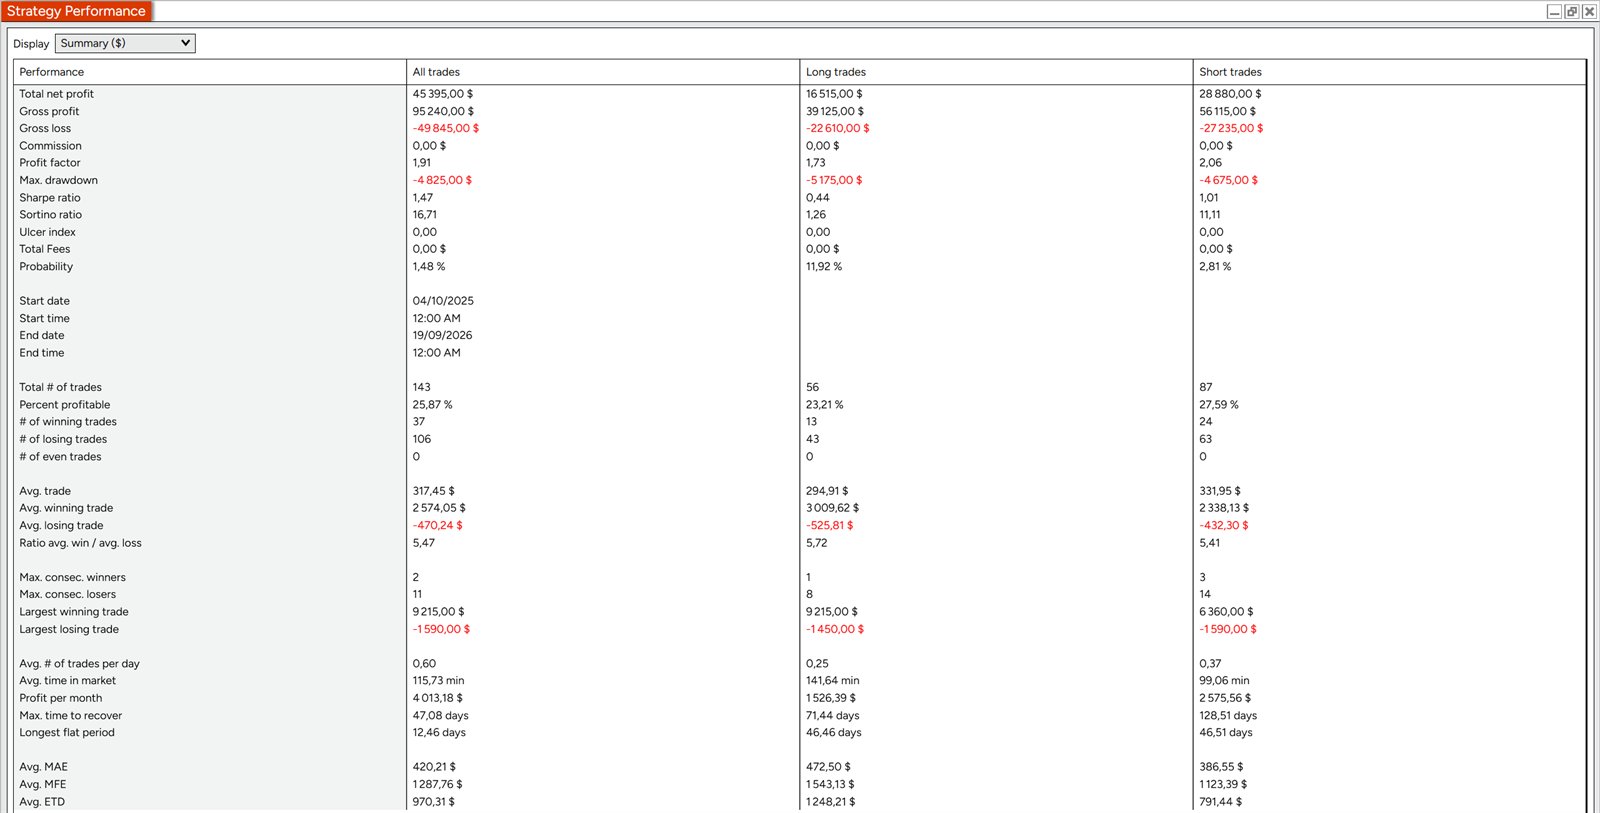
Test conditions: NQ DEC26, 1 contract, 4 Oct 2025 → 19 Sep 2026, commissions excluded. Sortino 16.71 · largest winning trade $9,215 · max consecutive losers 11.
Opening Range Breakout
Every model in the pack needs a session bias, and the opening range gives one. The ORB strategy marks the range, takes the break, and reverses on the trend flip — a complete, self-contained algorithm we give away to everyone who reserves a seat.
- Session opening range — defined by your own window, marked on the chart
- Break entries — long above, short below, with the same risk rails as the paid models
- Trend reverse — the position flips when the trend filter turns against it
- Runs on ES, NQ or your instrument — the published report is on ES
- Yours to keep — no trial, no card, no expiry
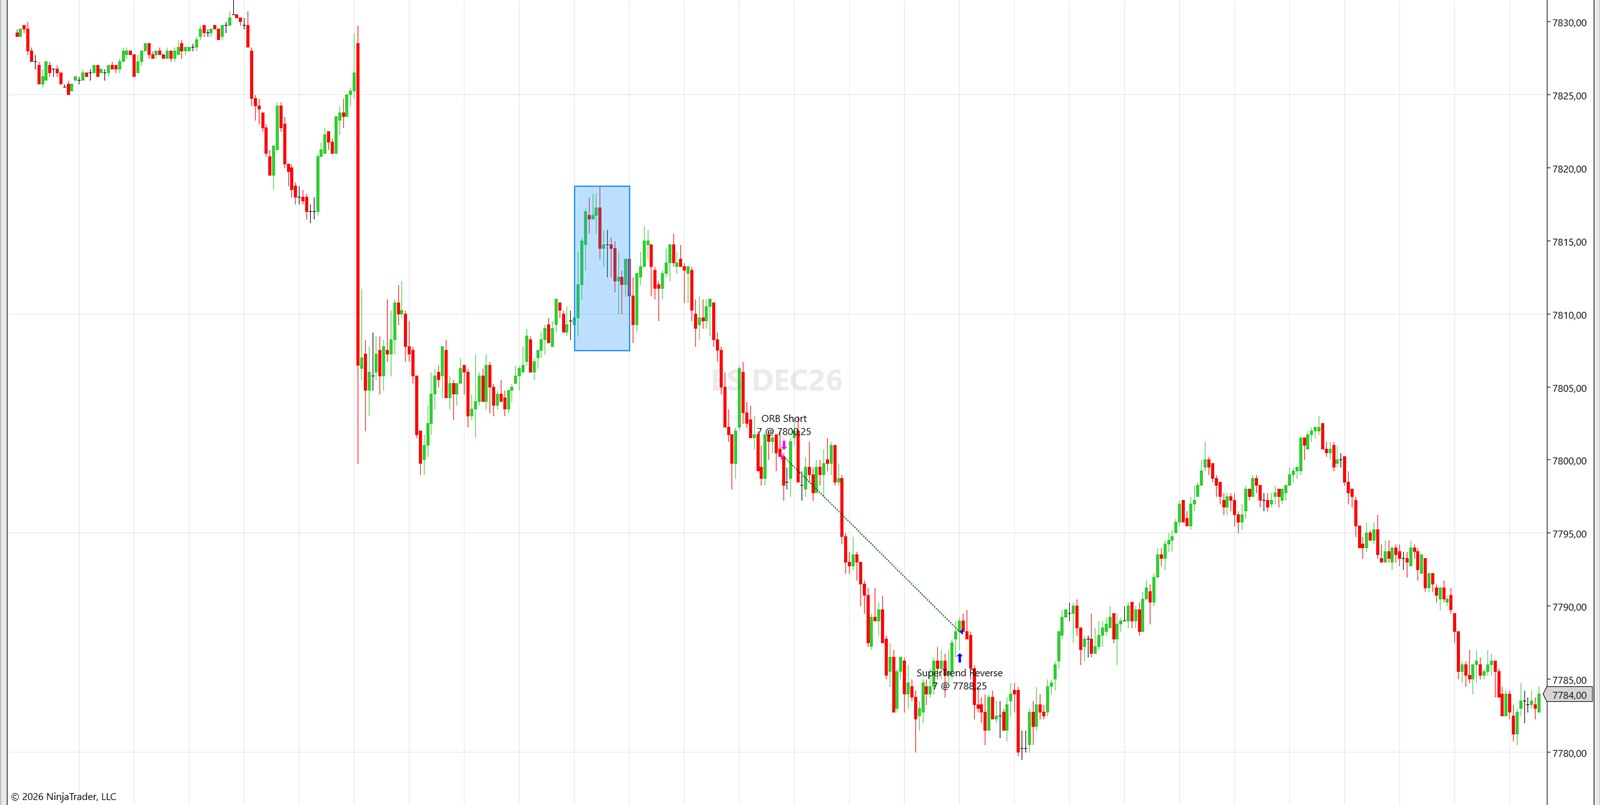
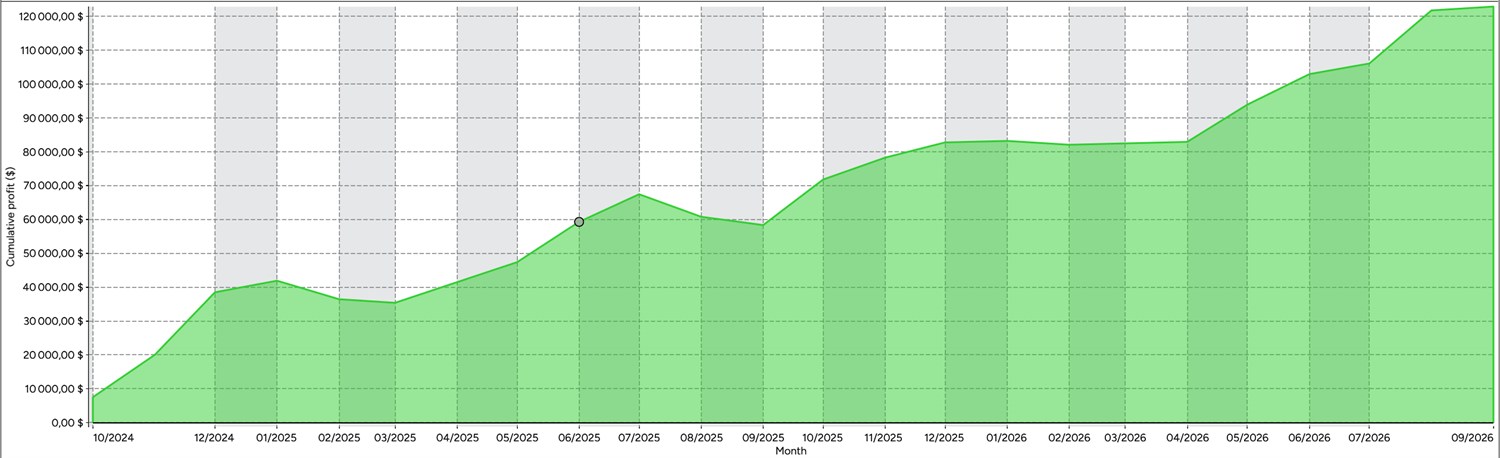
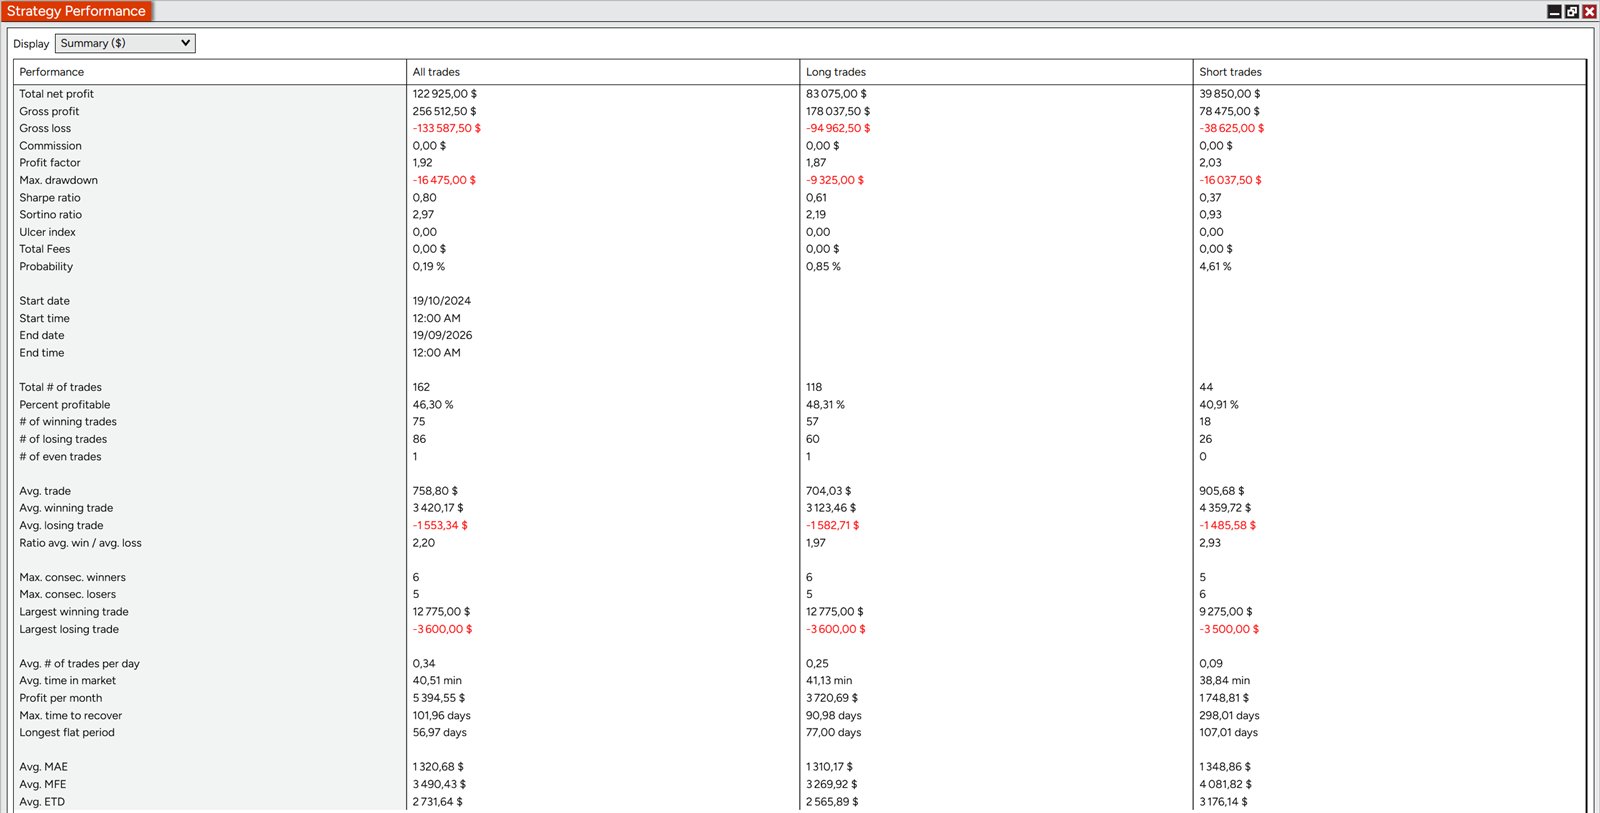
Test conditions: ES DEC26, 19 Oct 2024 → 19 Sep 2026, commissions excluded, position size as configured in the published report. Sharpe 0.80 · largest winning trade $12,775.
The part that keeps the account alive
A model that enters well and exits badly is a losing model. These controls ship with all four strategies, and every one of them is a parameter you set before the session starts.
Four session windows
Trade the London open, the New York killzone and the afternoon — and nothing in between. Plus an automatic flatten at session close.
Daily limits
Maximum daily wins and losses, a maximum daily profit and a minimum daily PnL. Hit any of them and the strategy stops for the day.
Trailing & runners
Split a runner off the main position with its own target and trailing start, step and move — all measured in ticks.
Stop-loss bounds
Minimum and maximum stop distance with a tick offset, so an oversized zone never turns into an oversized risk.
Volatility & momentum filters
ATR floor and ceiling, RSI bounds, and SMA direction filters on both your chart and a higher timeframe.
LiveOnly execution
Switch from Backtest to LiveOnly and the strategy waits for real-time data, so going live never inherits phantom historical fills.
All three models. All six indicators. $120 a month.
The Whop store opens shortly. Reserve your seat in the Discord now, take the ORB strategy home tonight, and get first access — at launch pricing — the day checkout goes live.